3D visualization
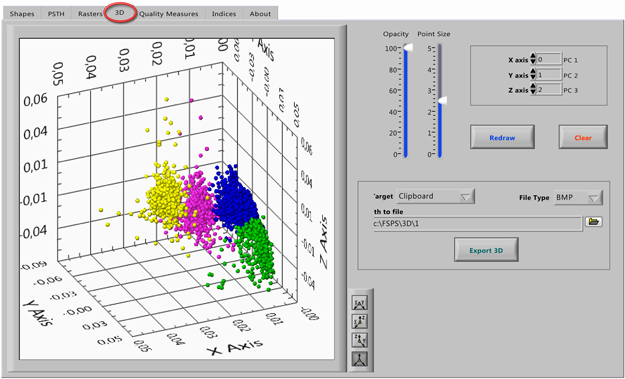
This Tab shows how the 3D Scatter Plot of first three PCs accumulating maximal variance. However, you can visualize any other PCs, by selecting their numbers in the proper controls (top right corner).
Other directions:
1) Drag the graph to change the view direction.
2) Press the <Shift> key when you drag the mouse up to zoom in and down to zoom out.
3) Press <Ctrl> key when you drag the mouse to move it around.
4) Change the view direction mode with the projection palette.