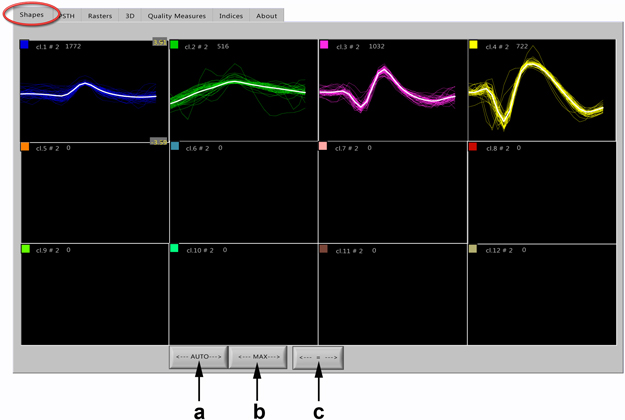
Spike Shapes

The number of spikes visualized for each cluster is determined by control “SPK show” at the group control 6 (Figure 2). Default is 50. White shape is an average spike profile for each class. Button “a” makes auto scaling (X and Y axes) for the first window (shapes marked in blue in our specific case). Button “b” performs the same operation as “a”, but regarding the maximal amplitude found in any other of the class. Pressing the button “c” applies the same scales and ranges for windows 2-12 as it is in the first one.
There is a possibility to use manual Y scale parameters by entering its numerical values at the first window (then press “c” button to apply it for all other windows).