Flow chart
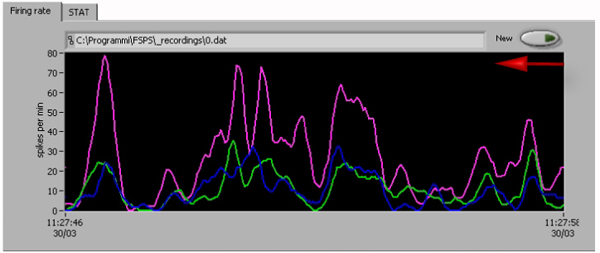
This Flow Chart shows the firing rate of isolated single units. At the top part of this Tab there is an indicator showing the file name and the path for data storage when “HDD steaming” button is “ON”. Pressing the button “New” at the right side creates new empty file. Its name is progressively increases.
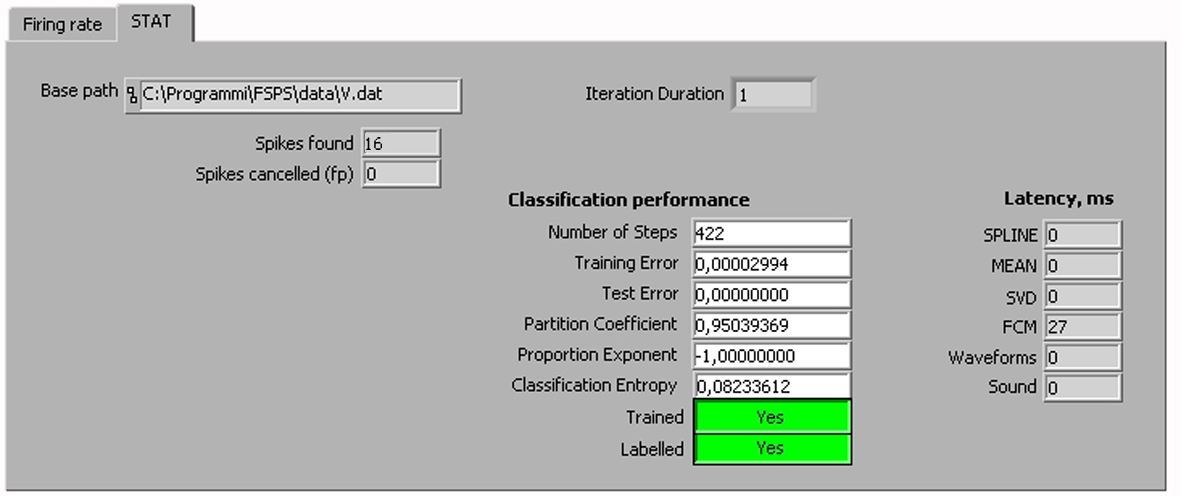
STAT Tab shows some additional information about performance of on-line classification module:
- “Base path” shows the path for V.dat file having the clusters prototype for your current recording. It is updated each time when you press “TEST” button (see Chapter 2, Figure 2).
- “Spikes found” shows the number of spikes that were detected in the current time-frame and underwent automatic classification algorithm.
- “Spikes canceled” shows the number of spikes in the current time-frame that have been canceled by our algorithm of removing of false positives.
- “Classification performance” – group indicators showing basic Fuzzy C-Mean parameters and quality measures.
- “Latency,ms” is a duration of each critical step of spikes classification in milliseconds.
