Get Principal Components
This interface window emerges after pressing the button “Get PCs” (14 at the Figure 3).
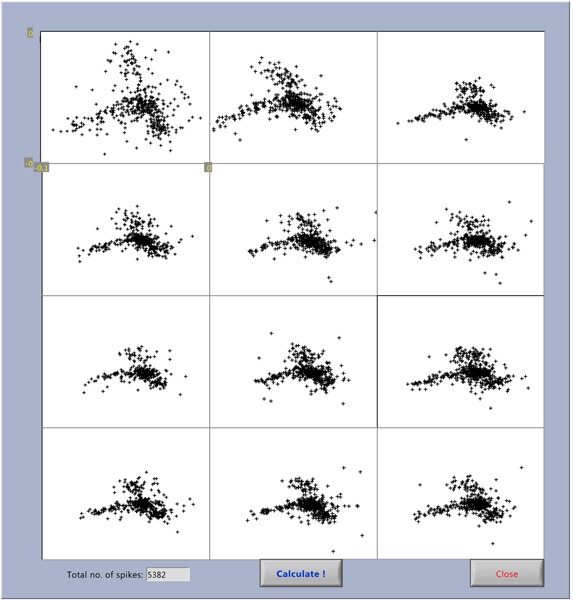
There are scatterplots of Principal Component 1 vs Principal Component 2 for each spike waveform extracted automatically from dataset. Such 2D spatial distribution of PCs gives experimenter the instant math look onto recorded dataset and consistency of trials within experimental Condition.
